SearchGSSI2022-07-28T08:39:03-04:00
X
Select from the drop-down menu below to see all the details of how Canada, the 10 provinces and 35 cities/ CMAs perform at various points in time. National level data includes the entire Canadian population. However, the Northwest Territories, Nunavut, and Yukon and certain cities were excluded from lower levels of analysis given small sample sizes.
The Health data is from the Canadian Community Health Survey (CCHS) cycles 2000-01, 2005, 2010, 2014, and 2018. Accordingly, data is available for the 1996 - 2000, 2001 - 2005, 2006 - 2010, 2011 - 2015, and 2016 - 2020 time periods. For more information on the study population and methodology, click here.
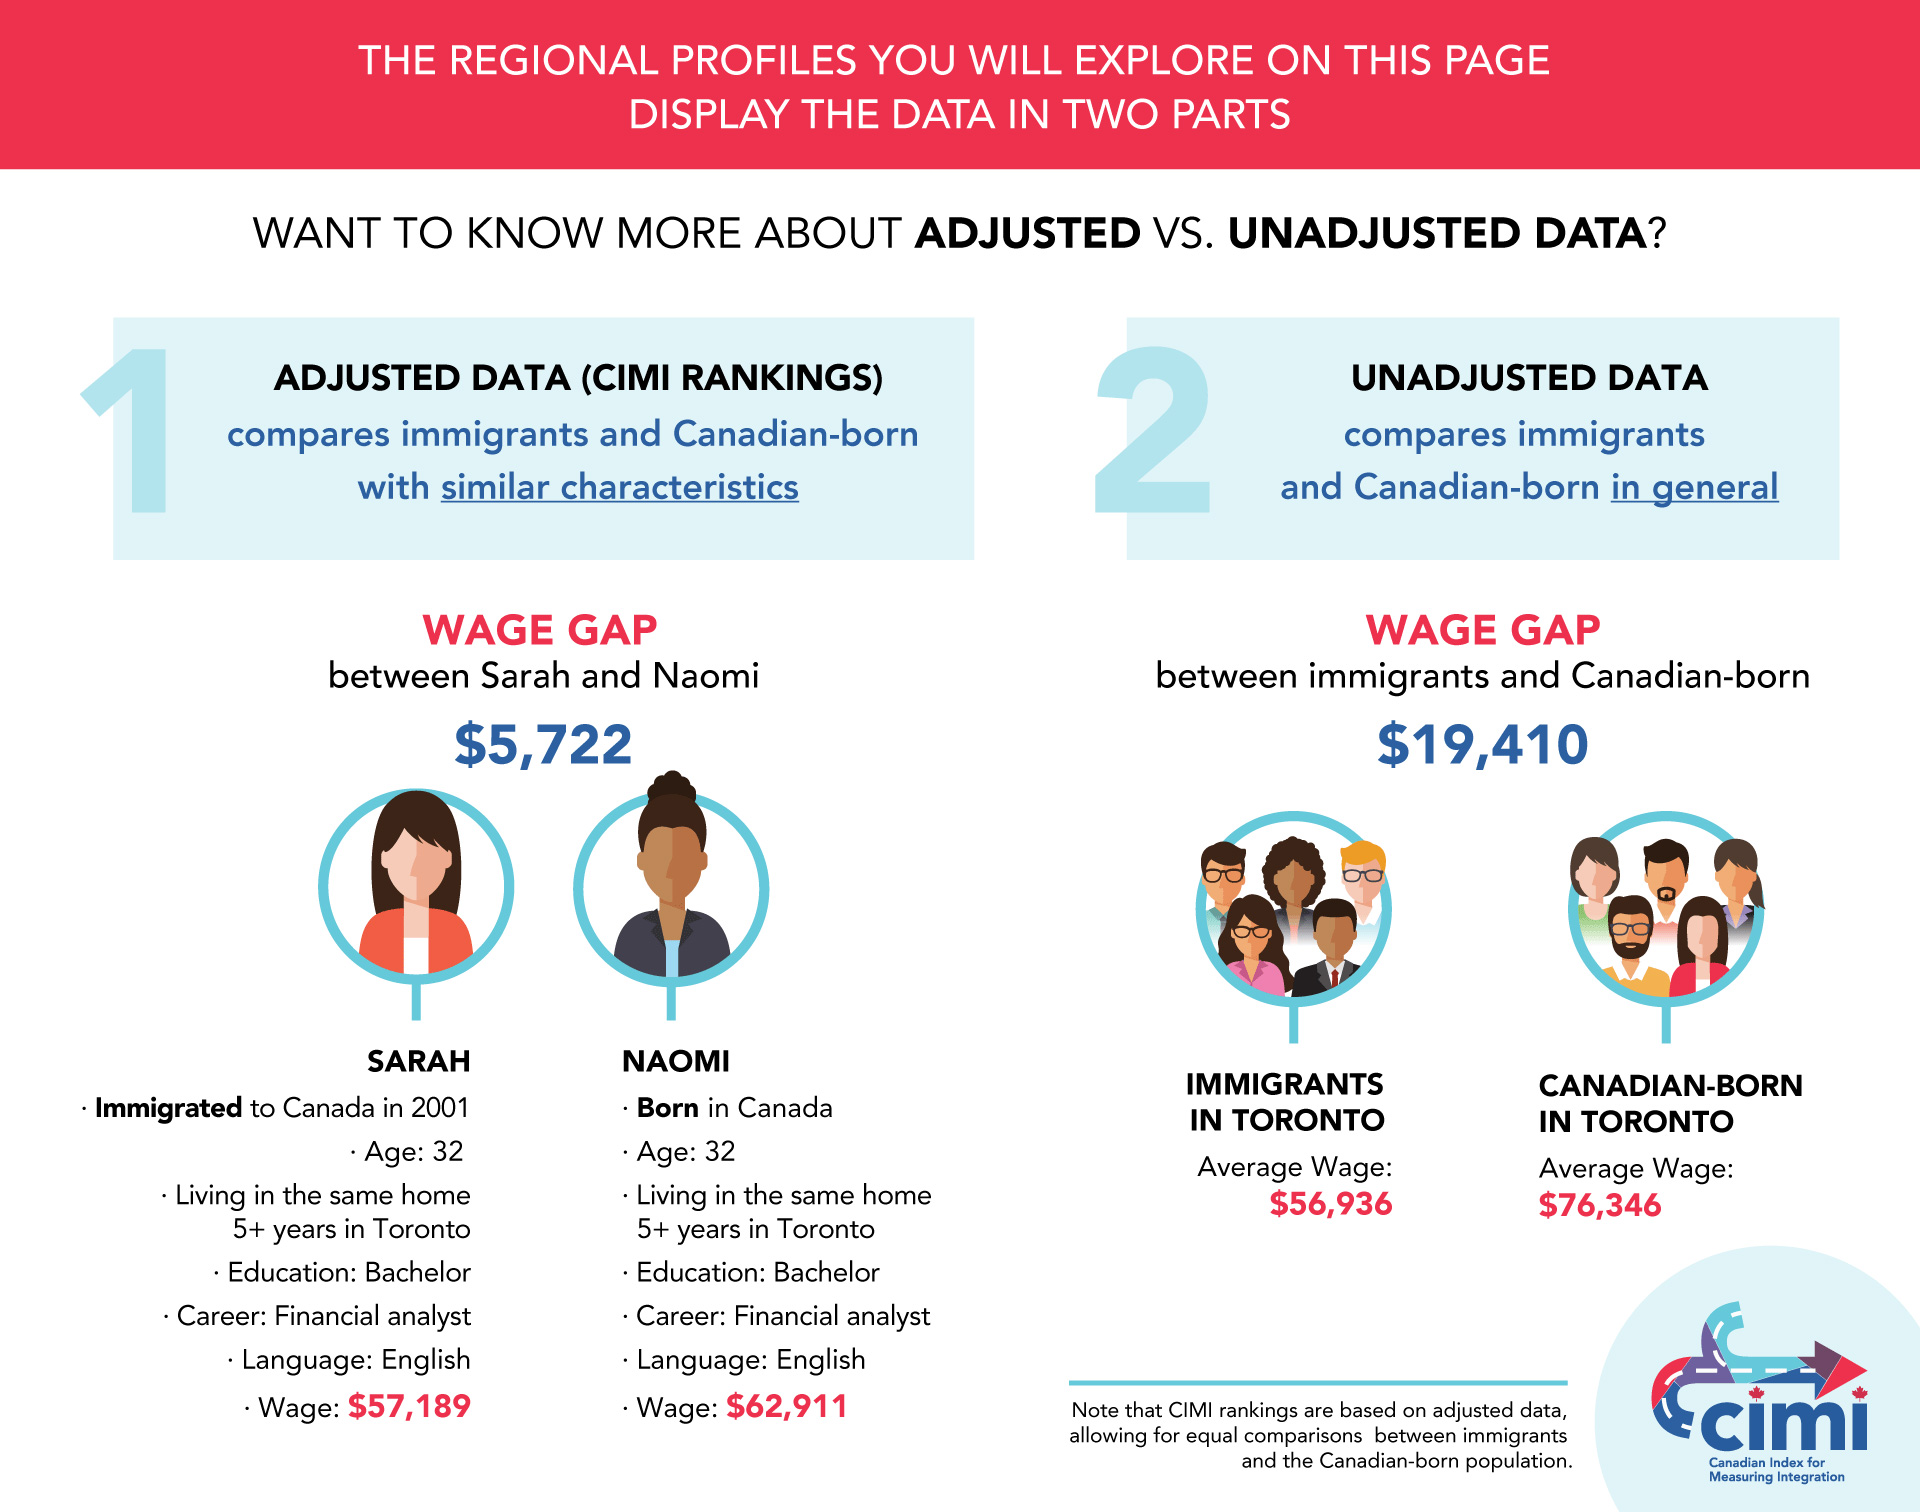
Below you will find 1) CIMI Ranking/ Adjusted Data and 2) Unadjusted Data.
Adjusted data -
have a regular medical doctor
In 2018, immigrants in Canada were 40.5% less likely to have a regular medical doctor compared to their Canadian-born counterparts with similar sociodemographic characteristics (e.g., age, sex, language, education, occupation, and visible minority status).
self-perceived life stress
In 2018, immigrants in Canada were less likely to report self-perceived life stress compared to their Canadian-born counterparts with similar sociodemographic characteristics (e.g., age, sex, language, education, occupation, and visible minority status).
self-perceived unmet health care needs
In 2018, immigrants in Canada were 36.4% less likely to report having unmet health care needs compared to their Canadian-born counterparts with similar sociodemographic characteristics (e.g., age, sex, language, education, occupation, and visible minority status).
Note: In 2018, this optional variable was only administered in the provinces/CMAs of Nova Scotia, New Brunswick, Ontario, Manitoba, Alberta.
satisfaction with life
In 2018, immigrants in Canada were less likely to be satisfied with life in general compared to their Canadian-born counterparts with similar sociodemographic characteristics (e.g., age, sex, language, education, occupation, and visible minority status).
Unadjusted data -
See below for the breakdown of immigrants and the Canadian-born population in this region. You can also click on "Expand Full Chart" below each bar chart to explore our added themes on sex, visible minority status and immigrant time of arrival. Any blank in the chart indicates that the data is unavailable/statistically insignificant.
Please note that the data below does not control for socio-demographic characteristics, unlike our rankings above.
Go to...- Have A Regular Medical Doctor
- Self-Perceived Life Stress
- Self-Perceived Unmet Health Care Needs
- Satisfaction With Life
have a regular medical doctor
Immigrants in Canada were slightly less likely to have a regular medical doctor (81.8%) compared to the Canadian-born population (84.5%) in 2018.
self-perceived life stress
Immigrants in Canada were less likely to report self-perceived life stress (21.4%) compared to the Canadian-born population (25.5%) in 2018.
self-perceived unmet health care needs
Immigrants in Canada were less likely to report having unmet health care needs (3.2%) compared to the Canadian-born population (5.5%) in 2018.
Note: In 2018, this optional variable was only administered in the provinces/CMAs of Nova Scotia, New Brunswick, Ontario, Manitoba, Alberta.
satisfaction with life
Immigrants in Canada were slightly less likely to be satisfied with life in general (39.3%) compared to the Canadian-born population (39.5%) in 2018.