SearchGSSI2024-06-08T10:41:11-04:00
X
Select from the drop-down menu below to see all the details of how Canada, the 10 provinces and 35 cities/ CMAs perform at various points in time. National level data includes the entire Canadian population. However, the Northwest Territories, Nunavut, and Yukon and certain cities were excluded from lower levels of analysis given small sample sizes.
The Economic data is from the 1991, 1996, 2001, 2006, 2011, and 2016 Canadian Census Program. For more information on the study population and methodology, click here.
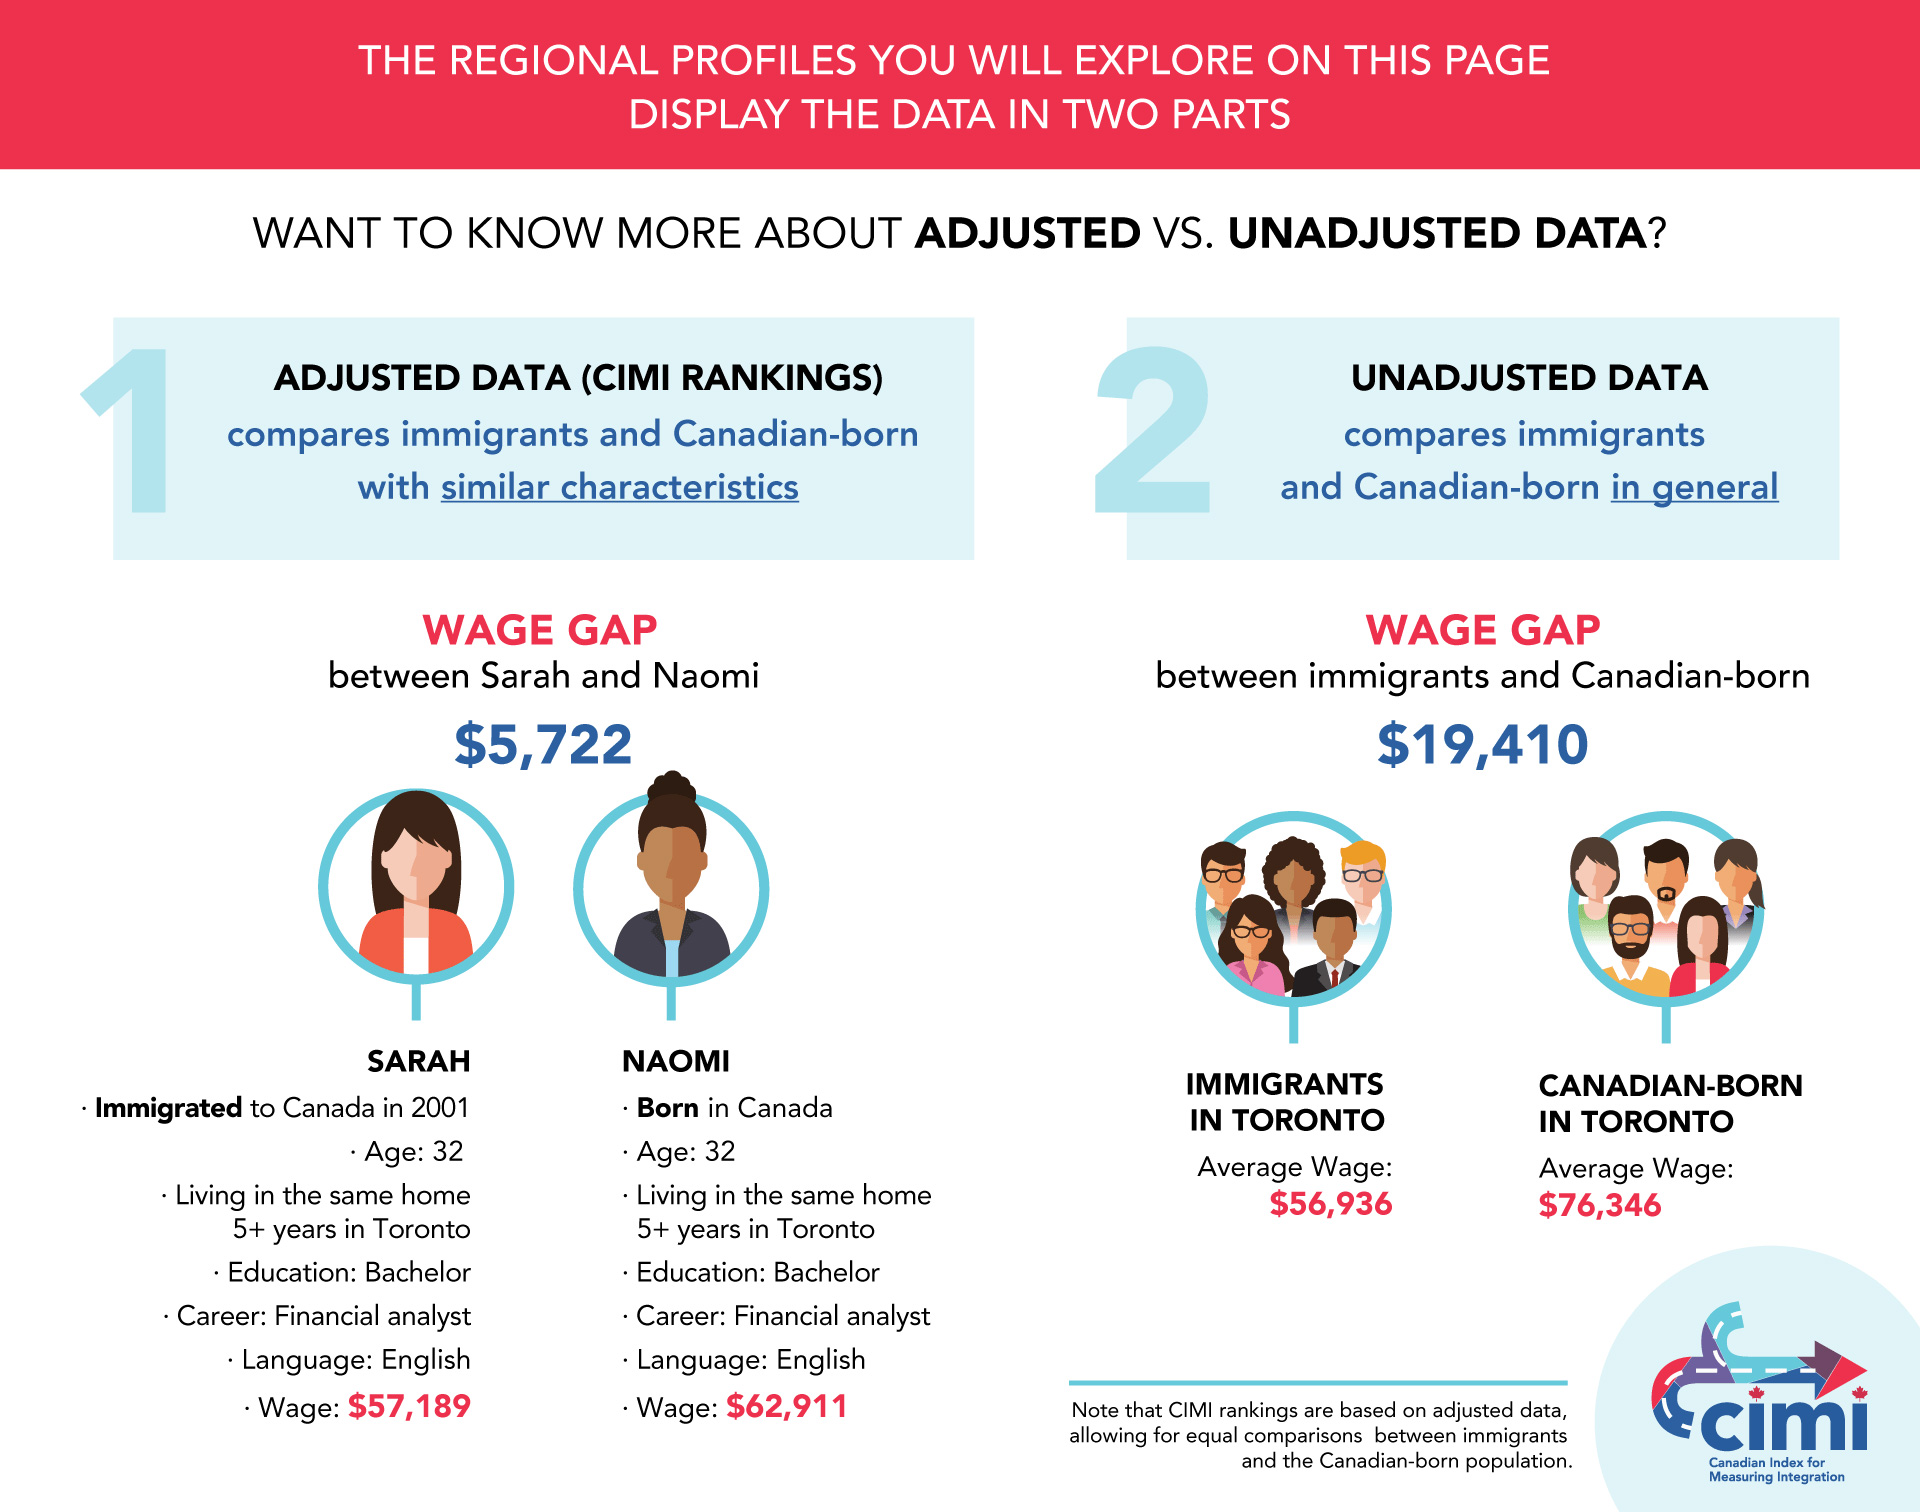
Below you will find 1) CIMI Ranking/ Adjusted Data and 2) Unadjusted Data.
Adjusted data -
Wages
Immigrant wages for both full-time and part-time workers were less than the wages for Canadian-born workers in this period. After accounting for socio-demographic characteristics such as age, sex, language, education, occupation, full-time work, visible minority and mobility status:
- The estimated wage gap was $5,941 for full-time workers.
- The estimated wage gap was $3,494 for part-time workers.
Low Income Cut-Offs (LICOs)
Immigrants were 53.2% more likely than the Canadian-born population to live below the low-income cut-off in this year, after considering for sociodemographic differences (e.g., age, sex, language, education, occupation, visible minority and mobility status).
Labour Force Participation
Immigrants were 13.4% more likely than the Canadian-born population to participate in the labour force in this year, after considering for sociodemographic differences (e.g., age, sex, language, education, occupation, visible minority and mobility status).
Employment Rate
Immigrants were 14.4% more likely than the Canadian-born population to be employed in this year, after considering for sociodemographic differences (e.g., age, sex, language, education, occupation, visible minority and mobility status).
Unemployment Rate
Immigrants were 12.6% less likely than the Canadian-born population to be unemployed in this year, after considering for sociodemographic differences (e.g., age, sex, language, education, occupation, visible minority and mobility status).
Full-time Employment Rate
Immigrants were 4.1% more likely than the Canadian-born population to be employed full-time in this year, after considering for sociodemographic differences (e.g., age, sex, language, education, occupation, visible minority and mobility status).
Non-Official Language at Work
Immigrants were 7.5x as likely the Canadian-born population to speak a non - official language at work in this year, after considering for sociodemographic differences (e.g., age, sex, language, education, occupation, visible minority and mobility status).
Subsidized Housing
Immigrants were 8.3% less likely than the Canadian-born population to live in subsidized housing in this year, after considering for sociodemographic differences (e.g., age, sex, language, education, occupation, visible minority and mobility status).
Unadjusted data -
See below for the breakdown of immigrants and the Canadian-born population in this region. You can also click on "Expand Full Chart" below each bar chart to explore our added themes on sex, visible minority status, immigrant admission categories and immigrant time of arrival. Any blank in the chart indicates that the data is unavailable/statistically insignificant.
Please note that the data below does not control for socio-demographic characteristics, unlike our rankings above.
Go to...- Wages
- Low-Income Cut-Offs (LICOs)
- Labour Force Participation
- Employment Rate
- Unemployment Rate
- Full-Time Employment Rate
- Non-Official Language at Work
- Subsidized Housing
median wages (full-time workers)
The Median annual wages for immigrants in 2016 were $45,378 compared to $51,024 for the Canadian-born population. Thus, the wage gap was $5,646.
Note: All wages seen here are before Consumer Price Index (CPI) adjustment. Download wages with CPI - adjustment here.median wages (part-time workers)
The median annual wage for immigrants in Canada was $12,556 compared to $12,812 for the Canadian-born population. Thus, the wage gap was $256.
Note: All wages seen here are before Consumer Price Index (CPI) adjustment. Download wages with CPI - adjustment here.low income cut-offs (LICOs)
This year, 17.6% of immigrants in Canada were living below the LICO line compared to 10.3% of the Canadian-born population. Thus, immigrants were 7.3% more likely to be living below the LICO line than the Canadian-born population.
labour force participation
This year, the labour force participation rate for immigrants in Canada was 78.3% compared to 80.6% of the Canadian-born population. Thus, immigrants were 2.2% less likely to participate in the labour force than the Canadian-born population.
employment rate
This year, 72.4% of immigrants were employed compared to 74.6% of the Canadian-born population. Thus, immigrants were 2.2% less likely to be employed than the Canadian-born population.
unemployment rate
This year, 7.6% of immigrants were unemployed compared to 7.4% of the Canadian-born population. Thus, immigrants were 0.2% more likely to be unemployed than the Canadian-born population.
full-time employment rate
This year, 80.8% of immigrants in Canada had full-time employment rate compared to 79.6% of the Canadian-born population. Thus, immigrants were 1.3% more likely to work full-time hours than the Canadian-born population.
non-official language at work
This year, 7.7% of immigrants in Canada used non - official languages in the workplace compared to 0.4% of the Canadian-born population. Thus, immigrants were 7.2% more likely to use non - official languages at the workplace than the Canadian-born population.
subsidized housing
This year, 10.0% of immigrants in Canada were living in subsidized housing compared to 9.1% of the Canadian-born population. Thus, immigrants were 0.9% more likely to be living in subsidized housing than the Canadian-born population.