The economic impacts of the COVID-19 pandemic influenced the integration outcomes of immigrants – both recent immigrants and established immigrants in Canada. In general, these groups are more negatively affected by the COVID-19 crisis than those born in Canada, and these disparities create additional barriers to the integration process. Tracking the impact of the COVID-19 pandemic on immigrants relative to the Canadian-born population with empirical evidence and incorporating this into the CIMI is especially critical. In order to explore this, two analyses have been conducted.
In the first analysis Impact of Covid-19 on Canadians – Crowdsourcing Data, data from the Statistics Canada crowdsourcing surveys was used to test the feasibility of building an index to analyze gaps between immigrants and non-immigrants. We attempted to match crowdsourcing data to some of the CIMI indicators and dimensions, looking at gaps between immigrants and non-immigrants across identity markers such as sex and visible minority status.
You may download this report from the link below.
The second analysis was focused on the CIMI economic dimension. Data from Statistics Canada’s 2019 and 2020 Labour Force Surveys was used to demonstrate how COVID-19 has affected the economic outcomes of immigrants, both recent and established.
Please use the drop-down menu below to access data from our second analysis. This will allow you to view information related to how Canada and its regions perform when immigrant economic outcomes are compared from one year prior to the COVID-19 crisis (2019), to during the COVID-19 crisis (2020). National level data includes the entire Canadian population. The data on this page is limited to the regions listed below due to sample size limitations.
Atlantic Region
Data below is based on the monthly Labour Force Surveys collected from January 2019 to December 2020.
Below you will find 1) CIMI Ranking/ Adjusted Data and 2) Unadjusted Data.
CIMI RANKINGS
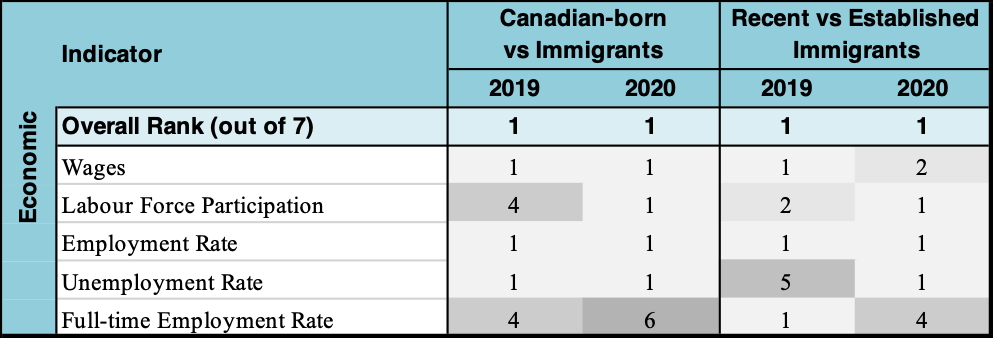
Atlantic ranks #1 out of the 7 regions for immigrant economic integration in 2019 and #1 in 2020. It ranks the same when the gap between recent and established immigrants is compared (#1 in 2019 and #1 in 2020).
Atlantic region performs very well on almost all of the economic indicators, including wages and employment rate, but performs poorly on the full-time employment rate. Region performs the same when the gap between recent and established immigrants is analyzed, with an even smaller gap in the full-time employment rate.


See below for the breakdown of immigrants, recent and established, and the Canadian-born population in this region. Any blank in the chart indicates that the data is unavailable/statistically insignificant. Please note that the data below does not control for socio-demographic characteristics, unlike our rankings above.
Go To:
Without accounting for socio-demographic differences, the wage gap between full-time immigrant workers and their Canadian-born counterparts varied prior to and during the pandemic, but it was less than $80. Recent immigrants were the group that had the lowest wage in most survey months, except in July 2020, when they had the highest. While the average gap between recent and established immigrants was $102, the largest was in September 2020, $203.
Note: All wages seen here are before Consumer Price Index (CPI) adjustment.
Without accounting for socio-demographic differences, part-time immigrant workers earned more than the Canadian-born in most survey months leading up to and during the COVID-19 crisis. The gap was varying, and it was widest in August 2019 when immigrants earned $97 more. On average, recent immigrants earned $11 more than established immigrants during these two years. In June 2019, the gap was largest, and they earned $147 more.
Note: All wages seen here are before Consumer Price Index (CPI) adjustment.
Without accounting for socio-demographic differences, immigrants have been more likely to participate in the labour force than the Canadian-born population. Labour force participation was over 75% for all groups until the impact of COVID-19 was felt in Canada in April 2020, where there was a significant drop. However, by June 2020, labour force participation bounced back to numbers prior to the pandemic, and at the end of the year, it was higher than in January 2019.
Without accounting for socio-demographic differences, the gap between all groups of immigrants and the Canadian-born population varied. However, the Canadian-born were generally less likely to be employed during these two years, except for the three-month period from May to July 2020. The most significant gap was in November 2020, 8%. A significant shift in the employment rate was seen from February to April 2020, when it went down by more than 10 percentage points (6% for established immigrants).
Without accounting for socio-demographic differences, until March 2020 established immigrants were consistently less likely to be unemployed than recent immigrants over the survey months; after this point and for the next 6 months, established immigrants were more likely to be unemployed. The unemployment rate varied for all groups, but it went sharply up at the onset of the pandemic in April 2020. The biggest jump in unemployment was for established immigrants (9%) and the smallest for recent immigrants (2.4%). After April 2020, the unemployment rate went down for all the groups, except for established immigrants. It was not until May 2020 when the unemployment rate started going down for them.
Without accounting for socio-demographic differences, recent immigrants in most survey months prior to and during the pandemic were less likely to work full-time than established immigrants; the gap varied and was at its largest in April 2020 (5.5%). The gap between immigrants and Canadian-born was smaller across all survey periods (less than 6 percentage points).
